
14 Dec 2024
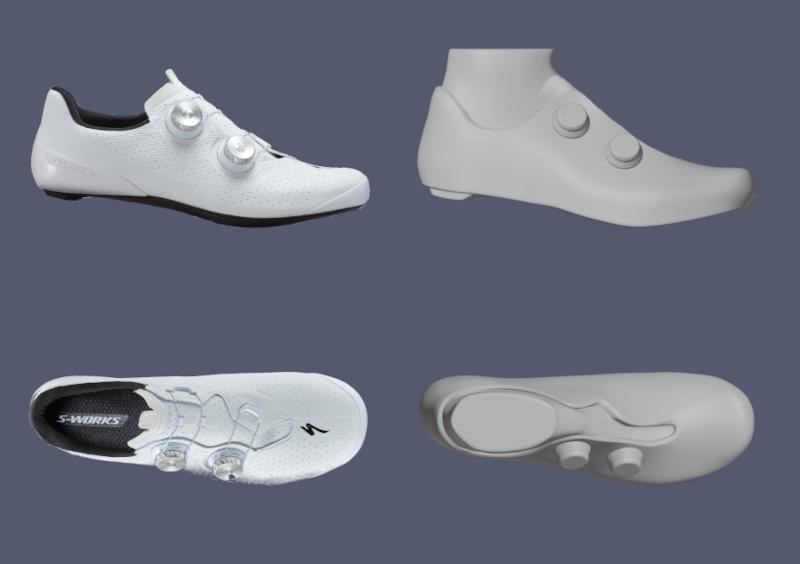
The goal of this CFD (Computational Fluid Dynamics) investigation was to assess whether the BOA closure mechanism, utilized for tightening and loosening laces in cycling shoes, increases drag force. Two simulations were carried out at realistic flow conditions. In the first, a high-end shoe (a Specialized S-Works Torch) with two BOA dials was used, in the second one, an identical shoe with no BOA dials. The present results are shown to capture the fluid dynamics around the BOA dials, which lead to drag increase versus a smooth shoe.
The simulations included the shoe and ankle to accurately replicate the interferences that the BOA dials can exert on adjacent elements. Adding other bodies such as the leg, body, bicycle, or ground would not have substantially modified the surrounding environment, and it would have introduced additional elements that could potentially amplify diffusion errors. The shoe has been studied in a position parallel to the ground, a condition that occurs when the crank reaches approximately 110° with respect to TDC (Top Dead Center), the 0 position of the pedaling cycle.
A workflow simulation requires a good geometry that includes only essential sharp angles to provide an optimal mesh. Therefore, a 3D scan of the shoe that would have indiscriminately duplicated it without discerning critical components from those that may be simplified or omitted to enhance the simulation has not been utilized. Instead, we choose to reproduce the shoe using Blender 3D computer graphics software, selecting the right amount of details and smoothness of the surface.
The mesh of the 3D model was constructed by seeking minimal values for skewness, orthogonality, aspect ratio, and growth rate. To model the region close to the wall where the friction of the wall affects the flow of the fluid, 12 boundary layers are introduced, and we placed the first cell center at a small distance from the wall (Y+ < 1), the so-called Low-Reynolds number modeling.
OpenFoam, an opensource CFD code, has been used for the simulation. It is assumed that there is no crosswind and that the cyclist is moving at a speed of 14 m/s (50.4 km/h). An unsteady simulation and a k-ω SST turbulence model have been employed, applying a turbulence intensity of 1%. The potentialFoam solver was initially applied, assuming the flow to be incompressible, irrotational, and inviscid and with vorticity uniformly zero, to obtain an initial solution. Since the initial transient is of no interest, a steady simulation has been used to initialize the flow. Before switching to a second-order discretization scheme, a first-order discretization scheme was used. Subsequently, the PISO (Pressure-Implicit with Splitting of Operators) solver, a pressure-based algorithm designed for transient simulations of incompressible flows, was adopted, utilizing a second-order discretization scheme. The time step was constrained to a maximum CFL number of 0.9. During the simulation, the minimum and maximum values of the field variables were constantly checked to verify that they don`t oscillate or diverge to unrealistic values and that the continuity errors are decreasing. The steps continuity errors and the minimum and maximum values of the field variables were monitored throughout the simulation. In order to assess convergence residuals, flow fields and scalar fields were assessed, keeping in mind that the analysed flow is unsteady.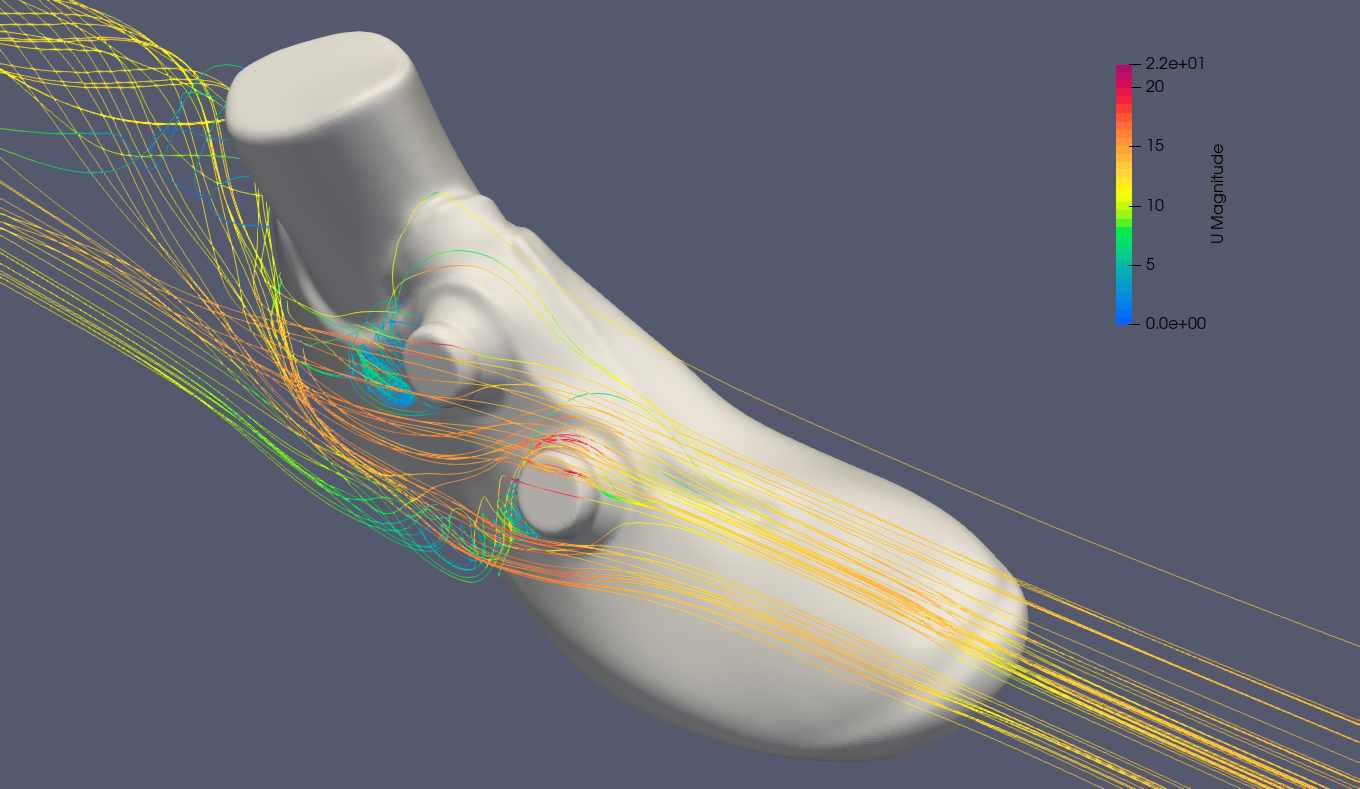
Streamlines colored by their velocity magnitude depict the generation of vortices behind both BOA dials.
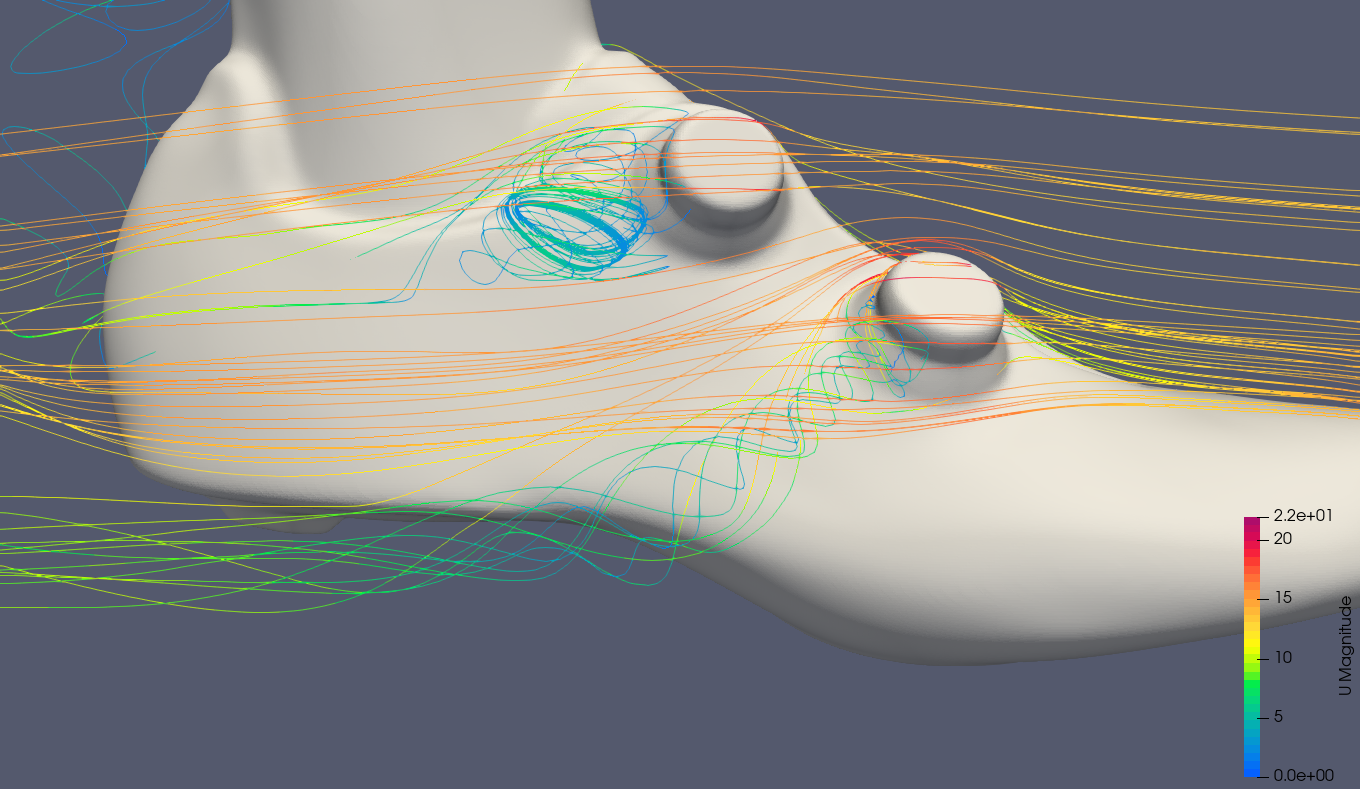
Side view of the shoe with streamlines passing over and around the BOA dials and generating vortices.
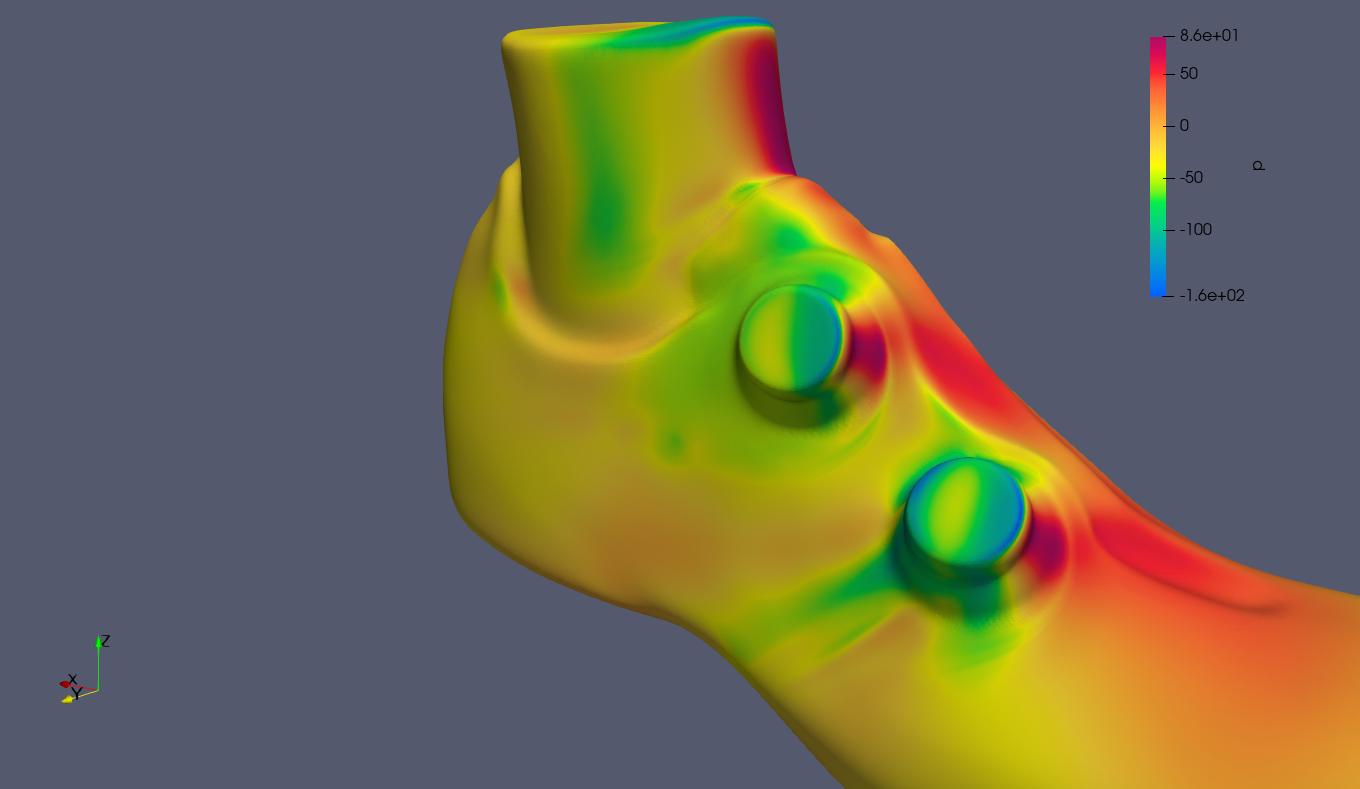
From this pressure representation, a high-pressure zone in the frontal side of the two BOA dials can be detected and a low-pressure zone on the rear side of the BOA dials.
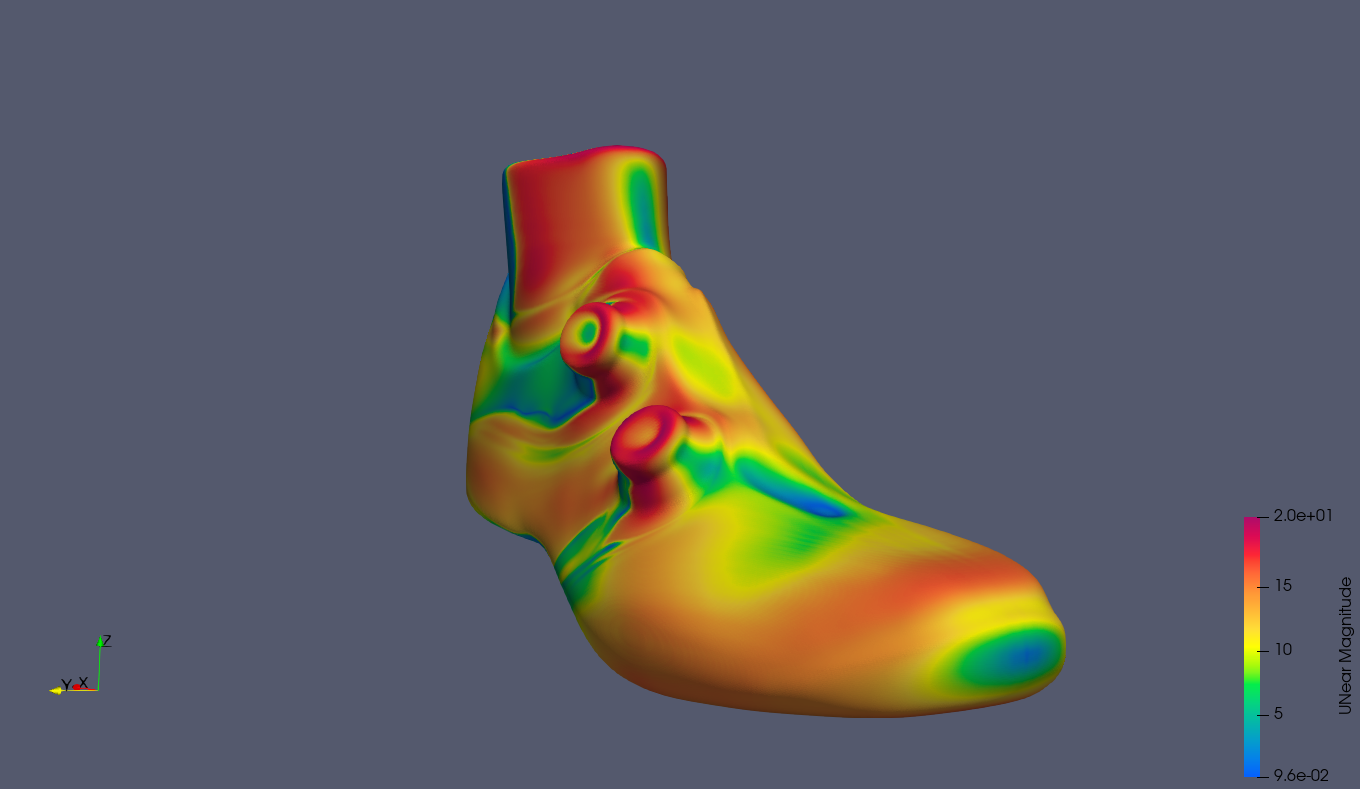
U-near, defined as the flow velocity at 1 mm from the surface of the shoe, results in close to zero in the frontal area of the BOA dials, where the pressure is maximal. Laterally, the velocity grows rapidly and then slows down posteriorly, as it is even more evident in the next image.
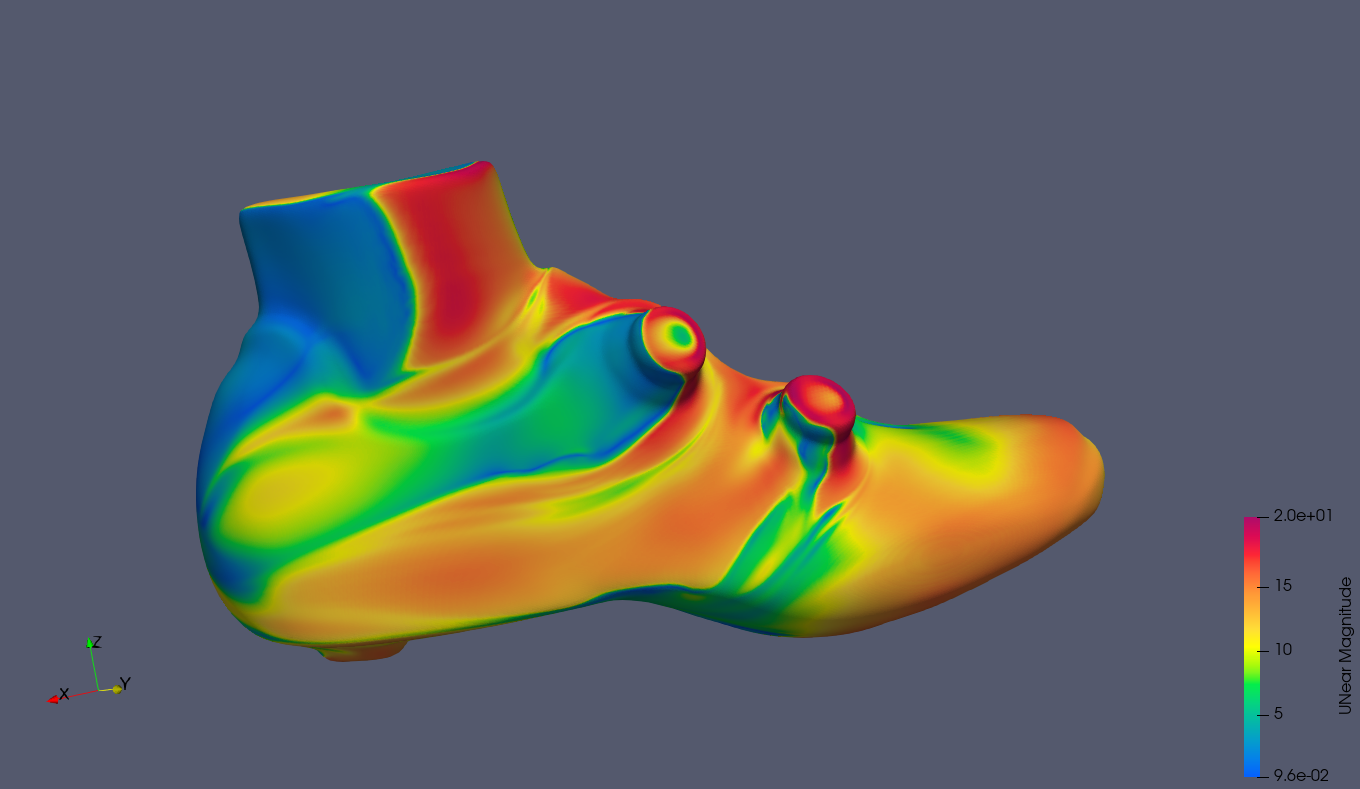
In the BOA dial closer to the ankle, the low velocity area behind the dial is very large and extends in its length toward the posterior end of the shoe.
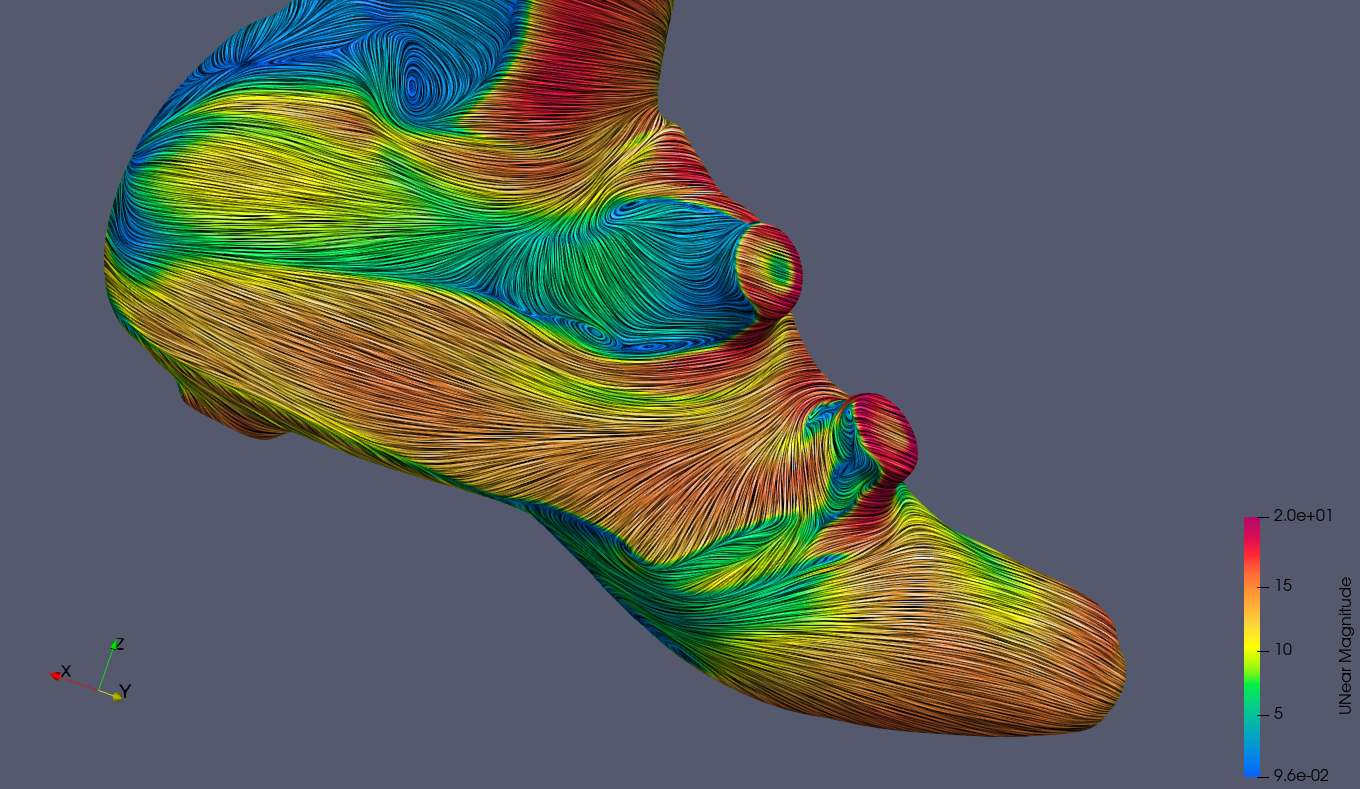
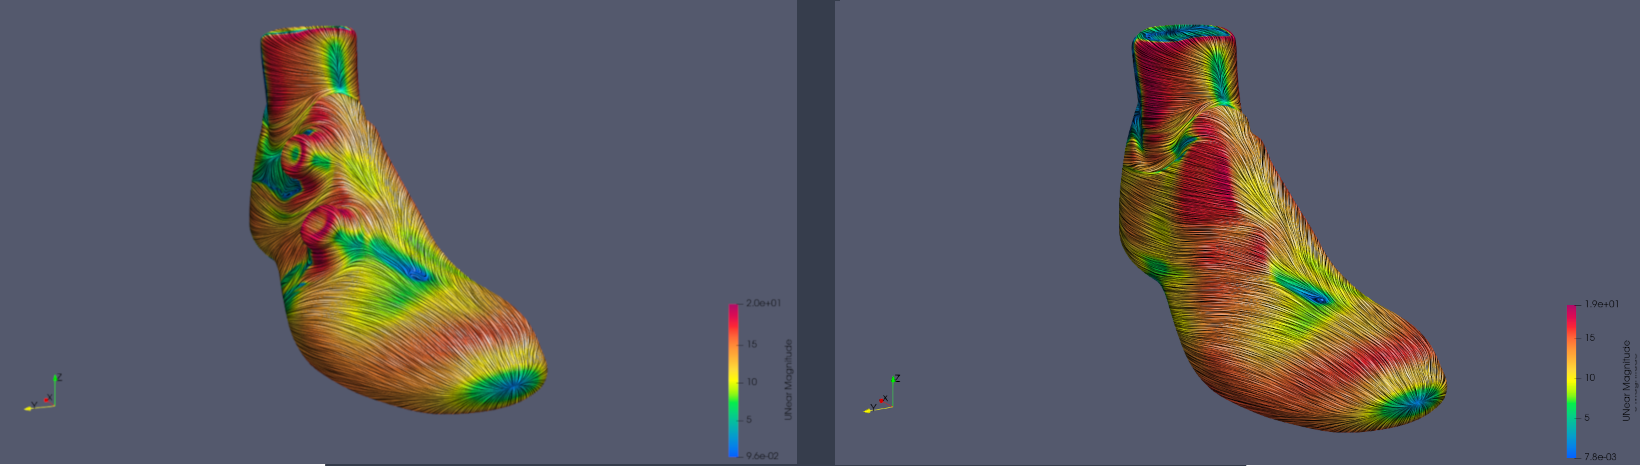
An image with a LIC representation with the velocity magnitude color-code.
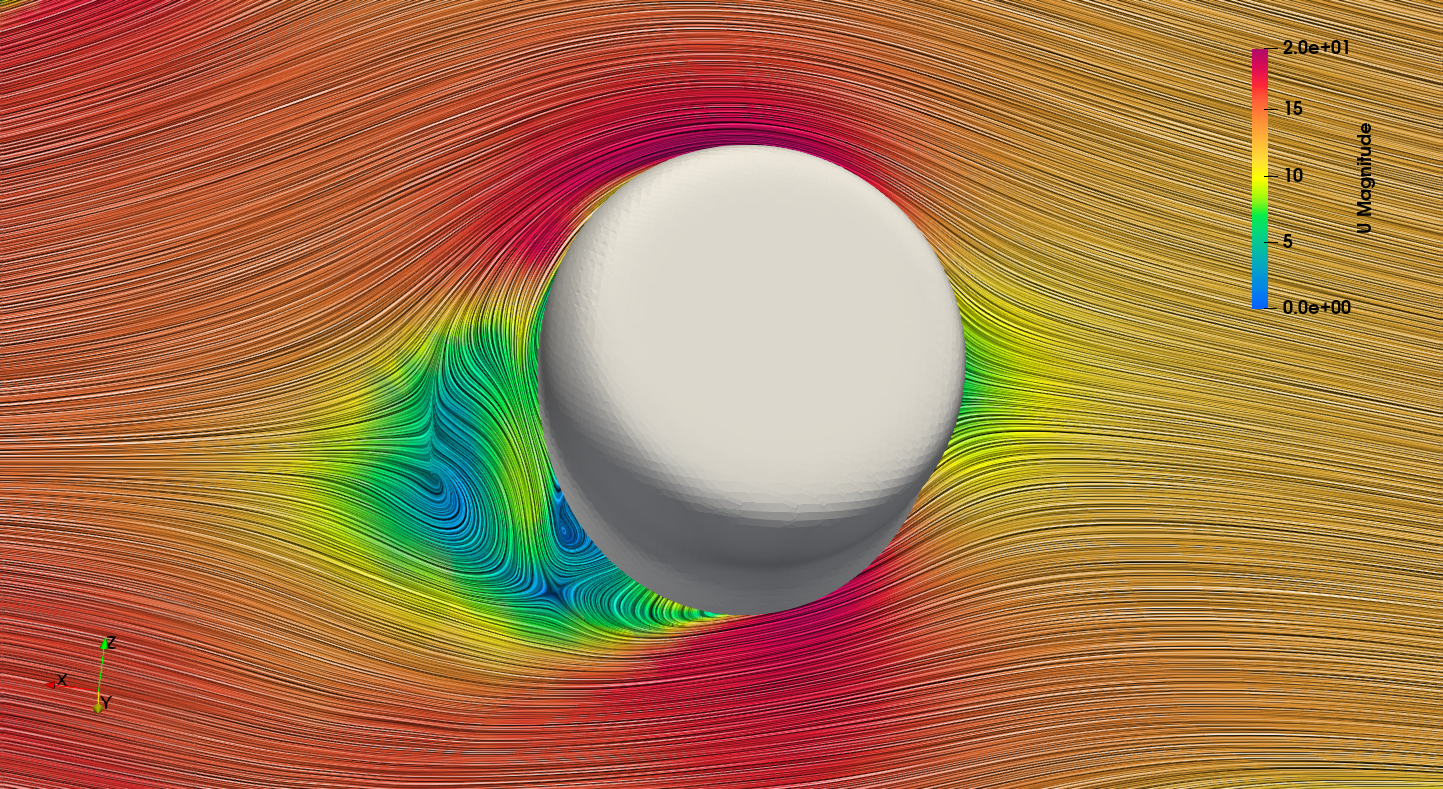
A close-up of a LIC image showing a planar slice of the frontal BOA dial. The vortices on the rear side of the dial are clearly visible.
The following two images shows a LIC representation with the velocity magnitude color-code from the two simulations. The left image represents the side view of the shoe with the BOA dials. The right one shows the shoe without the BOA dials where the flow is not disturbed by the two dials.
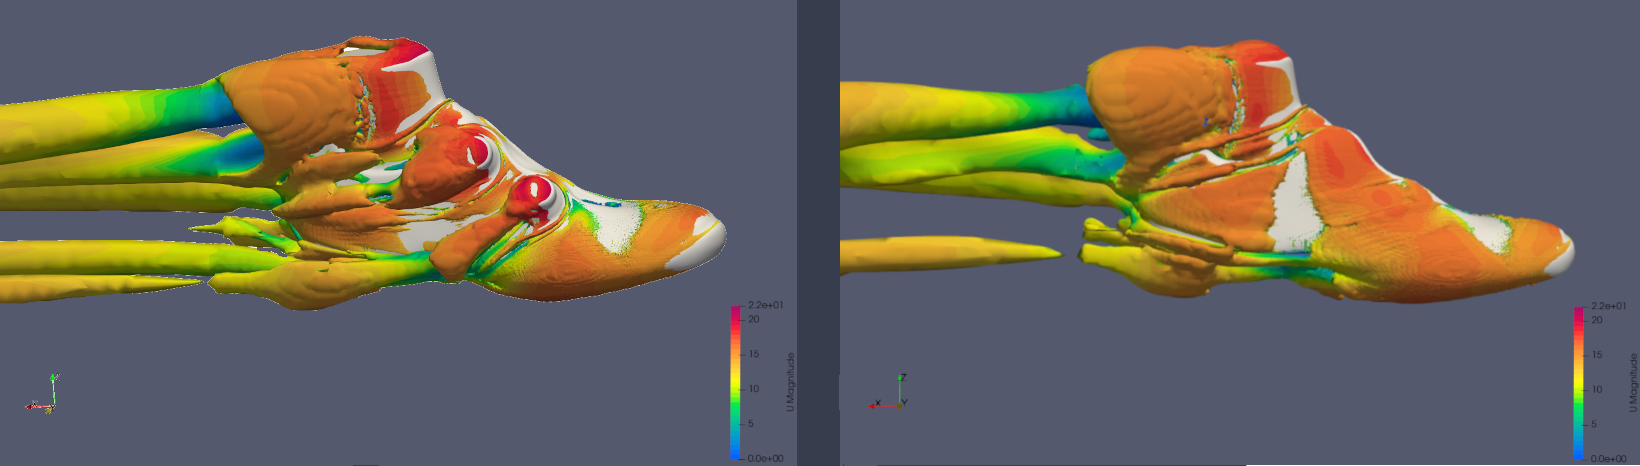
The vortical flow structures around the two types of shoe are visualized by the iso-surface of the Q-criterion and colored by the velocity magnitude. Vortices located posterior to both BOA dials are evident in the left image.
This research is based on some simplified assumptions such as using a frontal wind, a single position for the shoe, and disregarding the velocity of the shoe as it rotates around the bottom bracket, creating a relative wind. A lateral wind would probably influence the results by increasing the difference in drag of the shoes on the wind-facing side and reducing the drag on the opposite side. The influence of the slight inclination of the shoe in other positions along the pedaling cycle is, in our opinion, less significant. Finally, the relative wind of the pedaling rotation, supposing a cadence of 100 rpm, will generate a tangential velocity of 1.8 m/s with only minor influences. Nevertheless, the results of this study can be considered to have merit, showing that the aerodynamic disturbance created by the BOA dials is not negligible.