
5 Mar 2025
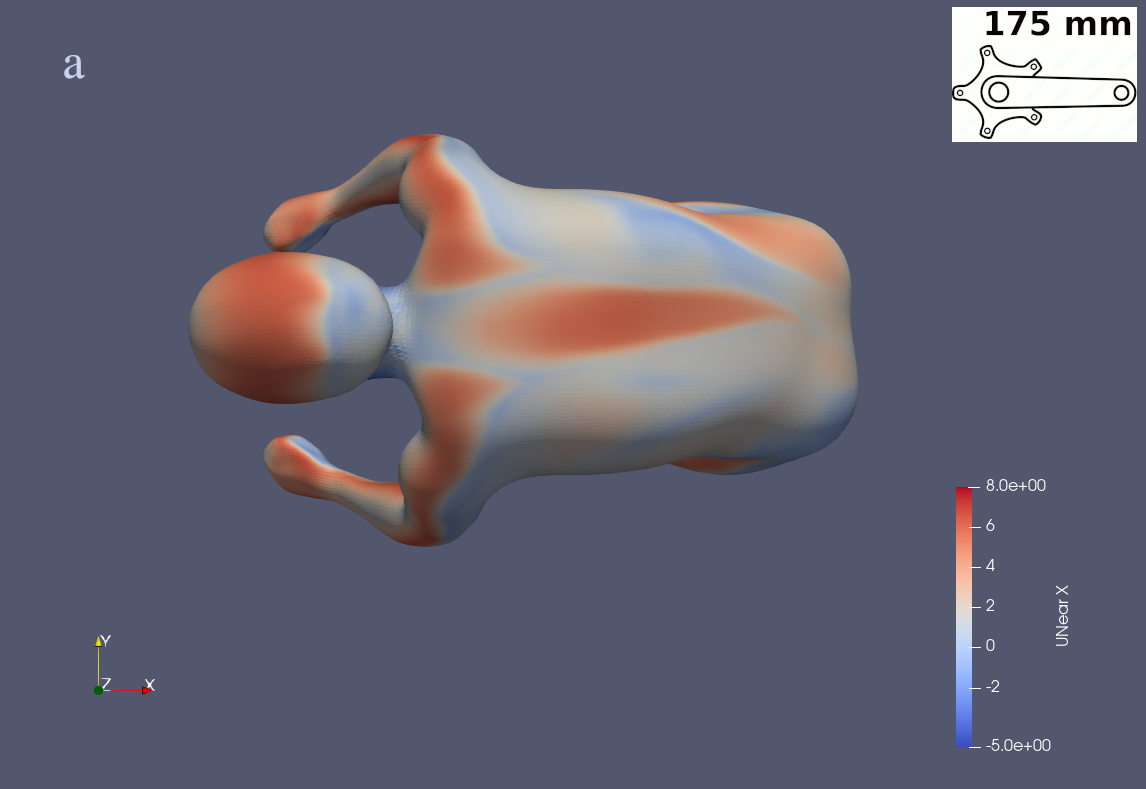
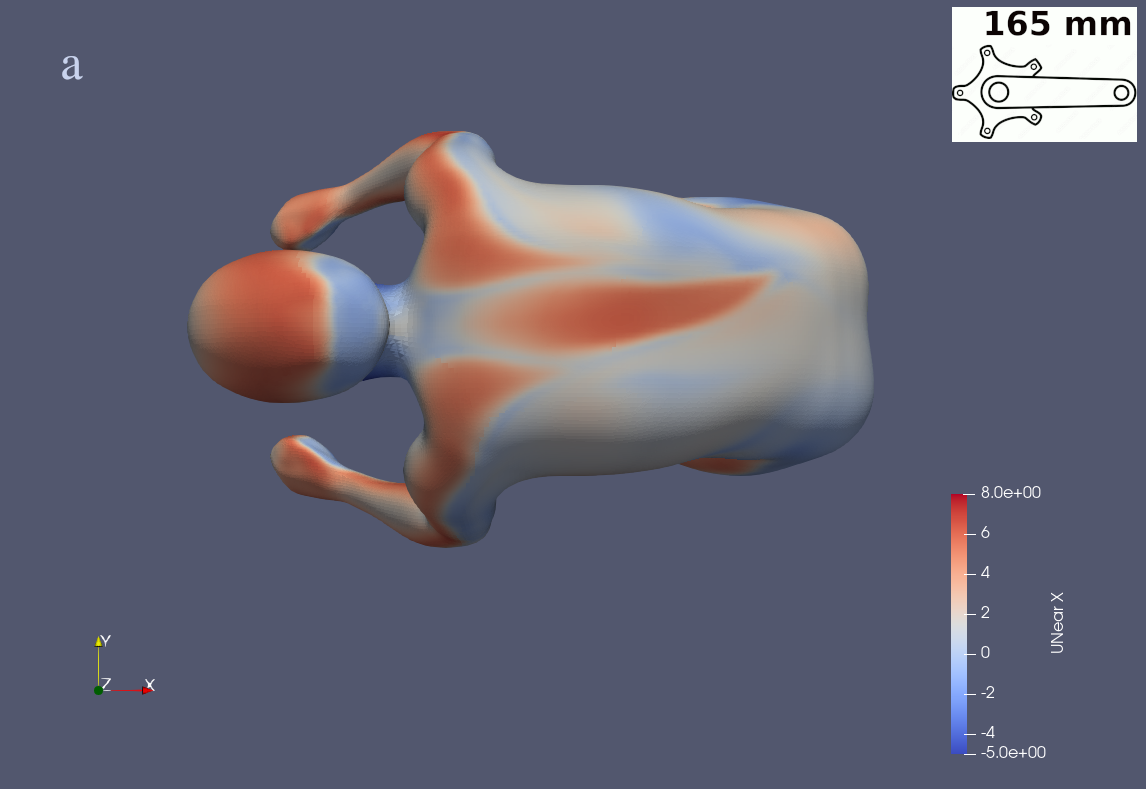
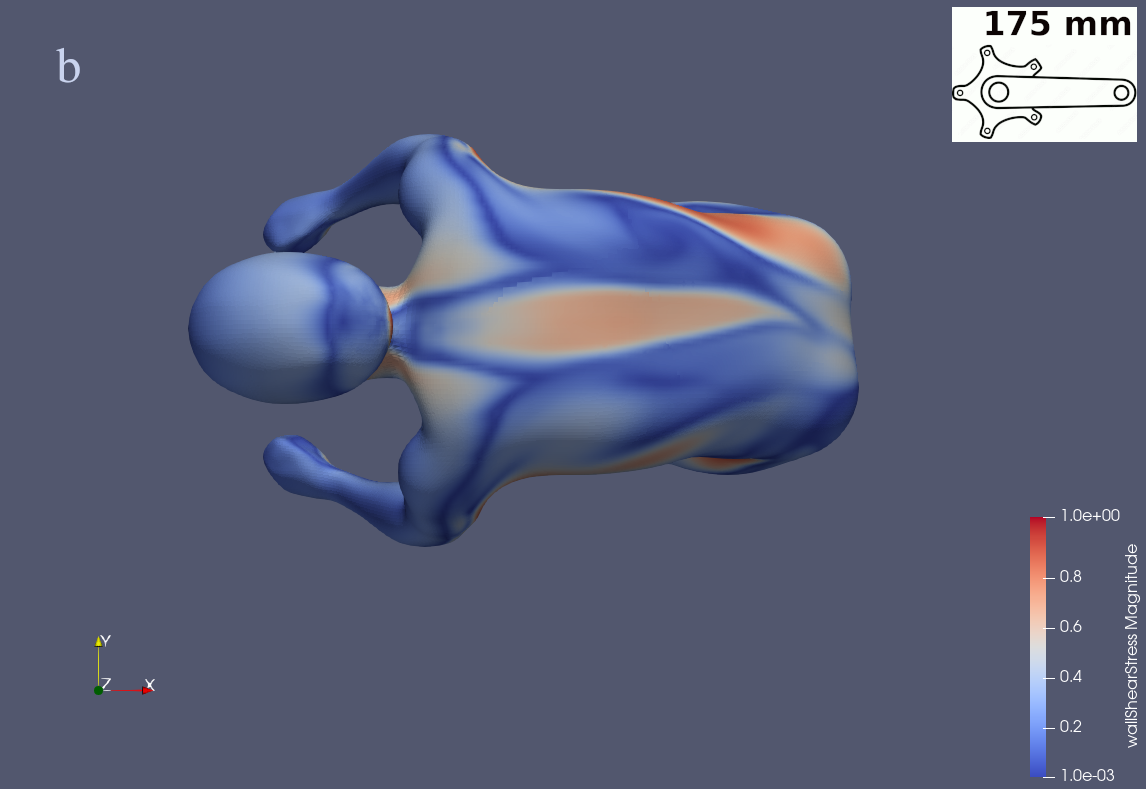
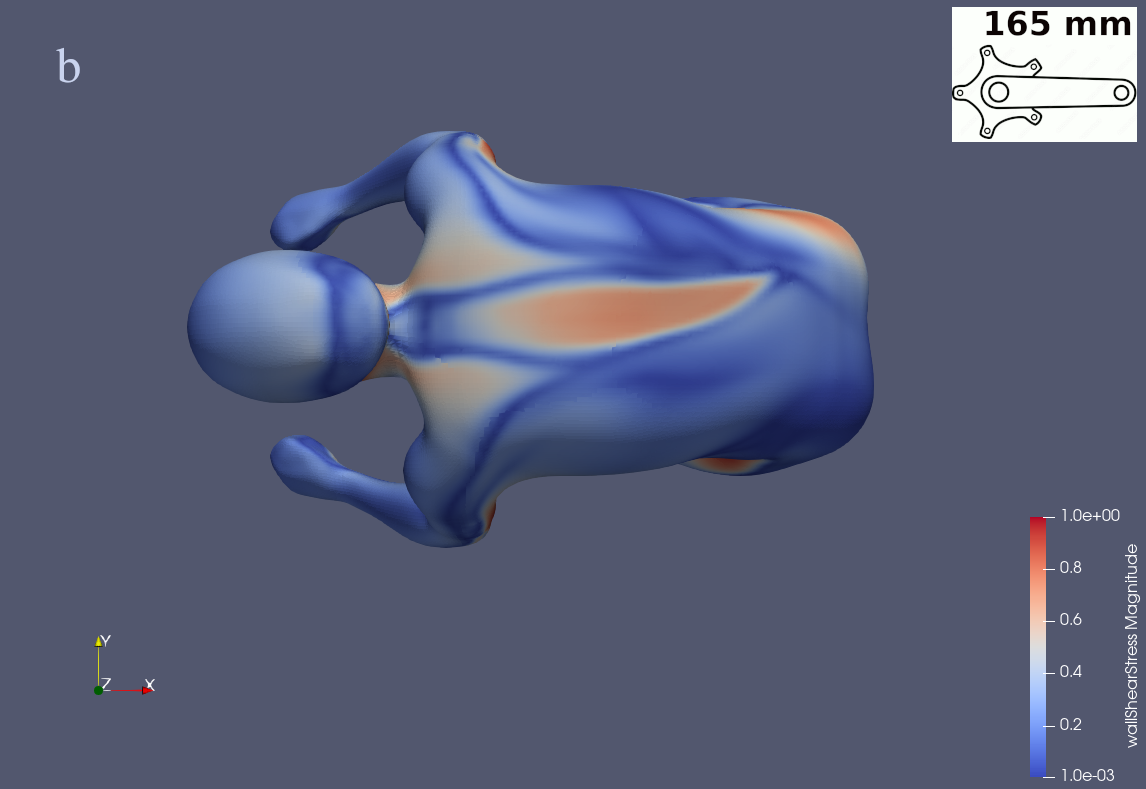
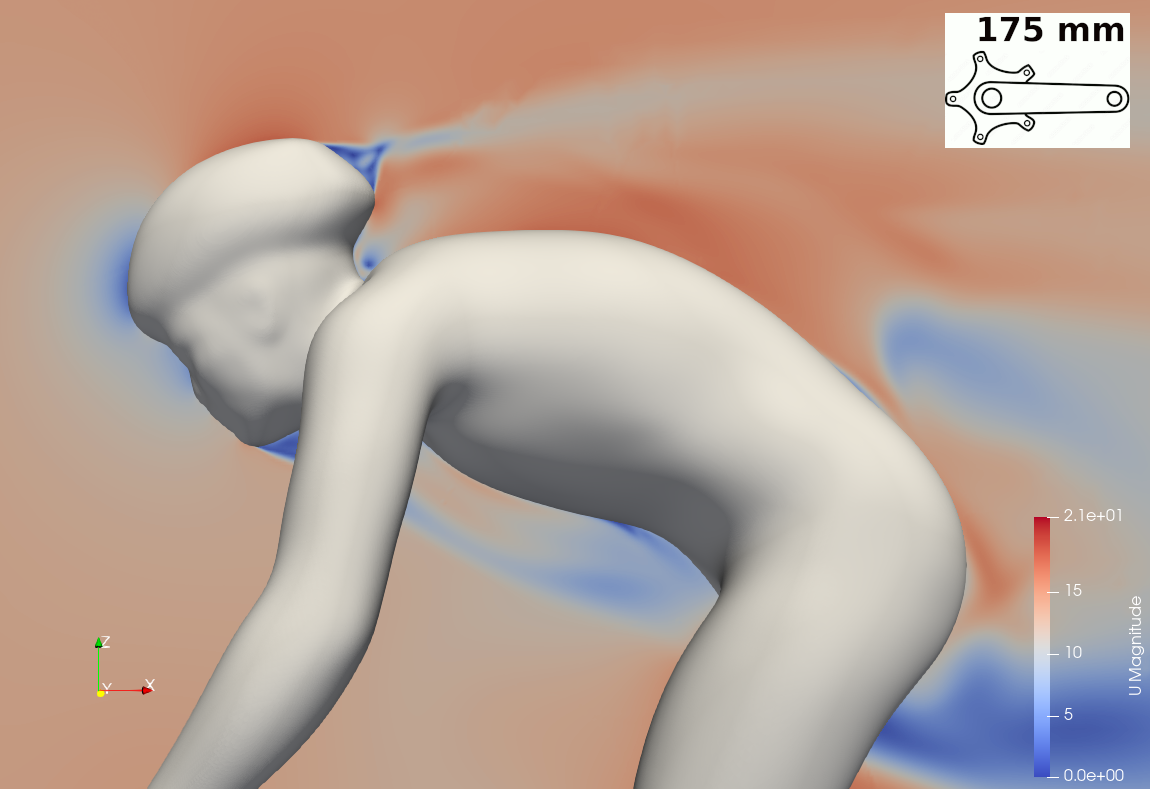
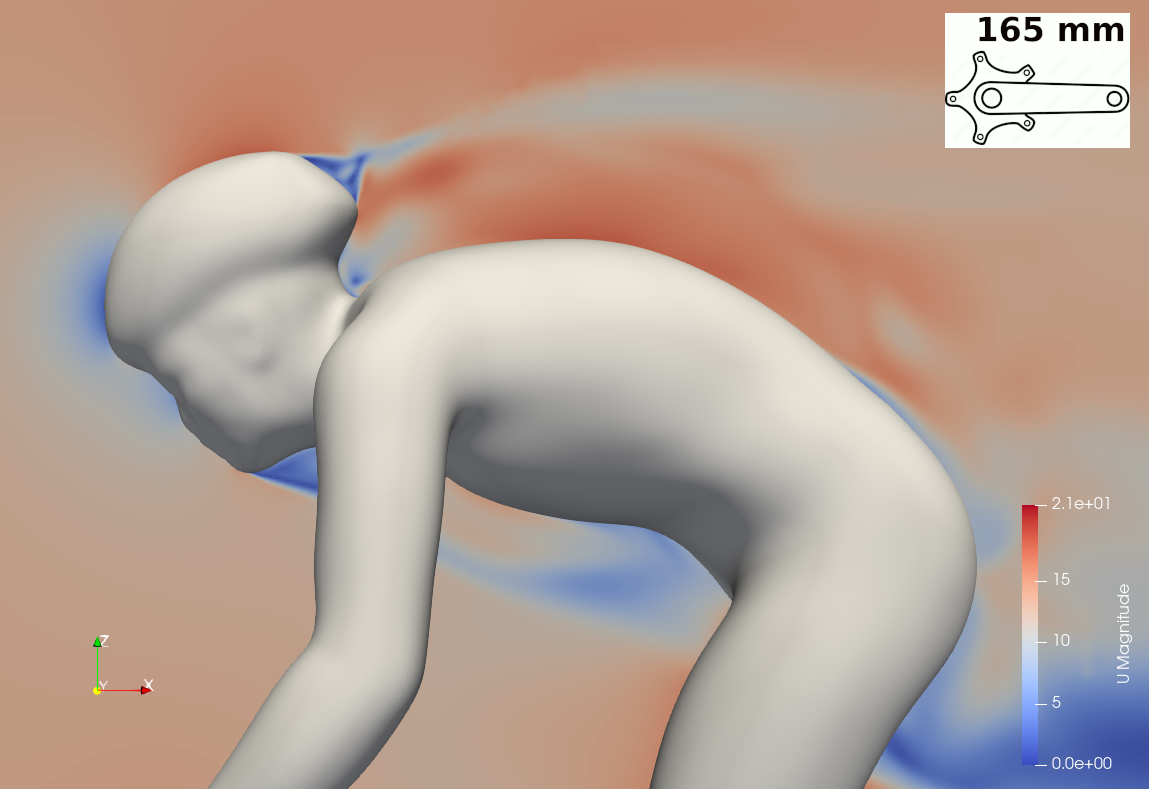
The goal of this study was to use Computational Fluid Dynamics (CFD) simulations to analyze the aerodynamic differences between two road cycling postures; one featured a 175 mm crank length and the other utilized a shorter 165 mm crank length. The simulations were conducted using a model of a real cyclist (excluding the bicycle) riding at a speed of 14 m/s (50.4 km/h) with no lateral wind. The shorter crank length enabled the cyclist to lower his torso, assuming what is considered a more aerodynamic posture. The simulations confirmed this assumption and revealed that torso rotation is the most crucial parameter in reducing the frontal area and achieving a more streamlined airflow.
A representative cyclist (male, 24 years old, 1.76 m in height, 65 kg in weight) was selected from a group of eight high-level competitive road cyclists. These cyclists were previously analyzed for biomechanical changes associated with shorter crank use in our study, Changes in lower limb kinematics, kinetics, and muscle activity in cyclists using a shorter crank. . In the QEF laboratory, the selected cyclist was tested while riding with his standard longer cranks and shorter crank lenghts. Markers were placed on all relevant bony landmarks to accurately reproduce the kinematics of the lower limbs and the position of the upper body.
To maintain consistent leg angles at maximum extension (165º in the crank cycle, with 0º defined as the Top Dead Center - TDC), the cyclist adjusted the saddle upward and slightly backward, while keeping the same seatpost angle. The height and anterior/posterior position of the handlebars remained unchanged between the two testing conditions, and the cyclist was instructed to keep his hands on the hoods. Due to the shorter crank arm, the hip joint experienced less flexion when transitioning over the TDC, enabling a downward rotation of the torso, commonly referred to as a lower trunk posture. The cyclist exhibited an average trunk angle ϑ1 +ϑ2, relative to the vertical axis, of 68.9º in the first condition and 74.4º in the second (Figure 1). The leg position for the simulation was chosen, as depicted in Figure 1, to represent the most asymmetric case, as it could differentiate the left and right aerodynamic responses in the lower part of the body.

The cyclist’s body in a standing position was reproduced using a 3D scan. The resulting model was then used to precisely model the cyclist in Blender 3D, a computer graphics software. A mechanical skeleton rig was added to this final model. This process involves creating the necessary bones to move all body segments as desired. While this procedure is initially more time-consuming, it allows the body to be posed in more realistic cycling positions. In contrast, using a static 3D scan of the cyclist on his bicycle would result in lower limb angles that are not consistent with the loaded condition. Additionally, having a Blender file with an adaptive rig enables the exact replication of the cyclist’s movements when pedaling in different positions and/or at varying workload intensities with simple adjustments. Finally, Blender also allows for simplifying the model by omitting details that are insignificant or detrimental to the simulation.

OpenFOAM, an open-source CFD code, was used for the simulations, assuming no crosswind and a cyclist speed of 14 m/s (50.4 km/h). An unsteady simulation with the k-ω SST turbulence model was initially employed, applying a turbulence intensity of 1%. To obtain an initial result, the potentialFoam solver was used, which assumes that the flow is incompressible, non-rotating, non-viscous, and has uniformly zero vorticity.
Subsequently, since the initial transient was not of interest, a steady simulation was conducted, starting with a first-order discretization scheme and later switching to a second-order scheme. As the final step, the PISO (Pressure-Implicit with Splitting of Operators) solver, a pressure-based algorithm designed for transient simulations of incompressible flows, was applied with a second-order discretization scheme. The time step was constrained to a maximum CFL (Courant-Friedrichs-Lewy) number of 0.9.
During the simulation, the minimum and maximum values of the field variables were monitored to ensure they did not oscillate or diverge to unrealistic values, and the continuity errors were checked to decrease. Convergence was verified through residuals, flow fields, and scalar fields.


The sum of the pressure force (28.61 N) and the viscous force (1.07 N) causes the cyclist using the 175 mm crank length to experience a total force of 29.67 N. As shown in Table 1, the posture with the 165 mm crank length results in a total force of 28.70 N, representing a reduction of 3.38%. This force consists of a pressure force of 27.67 N (a decrease of 3.40%) and a viscous force of 1.03 N (a reduction of 2.91%). The overall lower drag for the 165 mm crank arm posture is attributed to a combination of a lower frontal area (-1.60%) and a lower drag coefficient (-1.64%).
| 175 mm crank length | 165 mm crank length (compared to 175 mm crank length) | |
| Total drag force | 29.67 N | 28.70 N (-3.38%) |
| Pressure force | 28.61 N | 27.67 N (-3.40%) |
| Viscous force | 1.06 N | 1.03 N (-2.91%) |
| Frontal area | 0.444 m2 | 0.437 m2 (-1.60%) |
| Cd (frontal area) | 0.556 | 0.547 (-1.64%) |
| Normal area | 0.473 m2 | 0.470 m2 (-0.64%) |
| Cd (normal area) | 0.522 | 0.508 (-2.75%) |
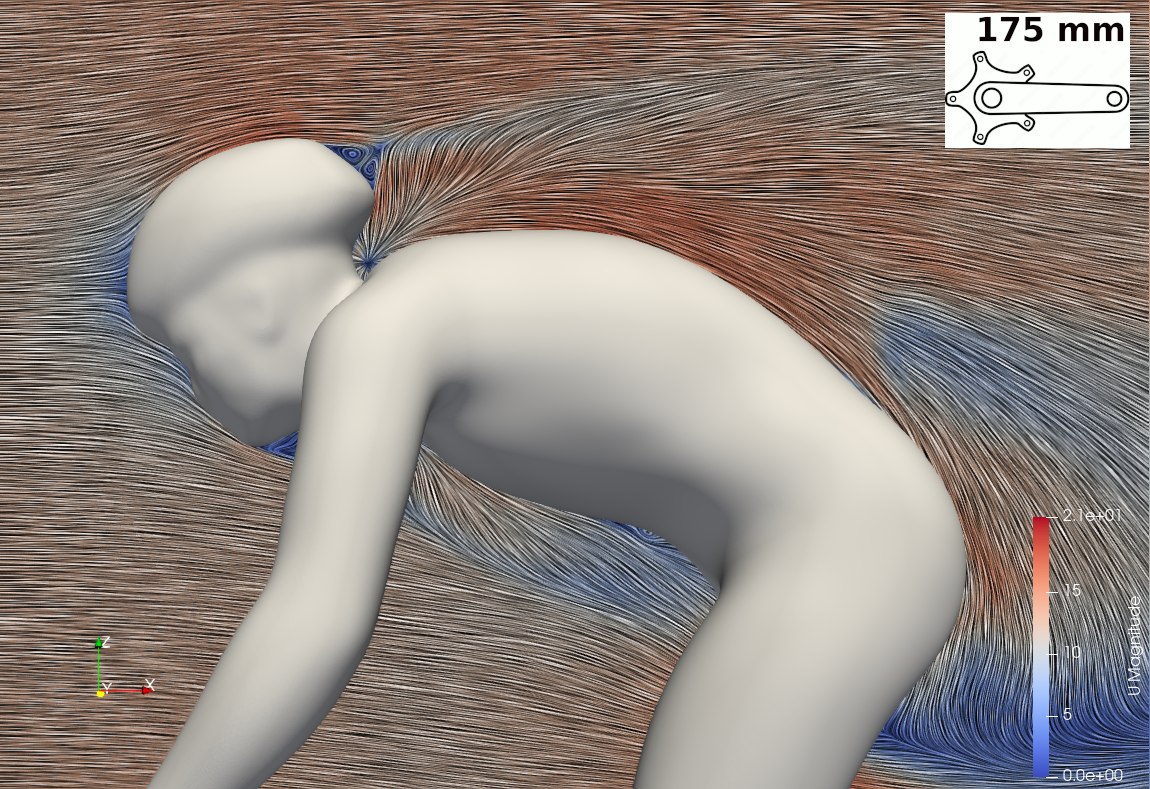
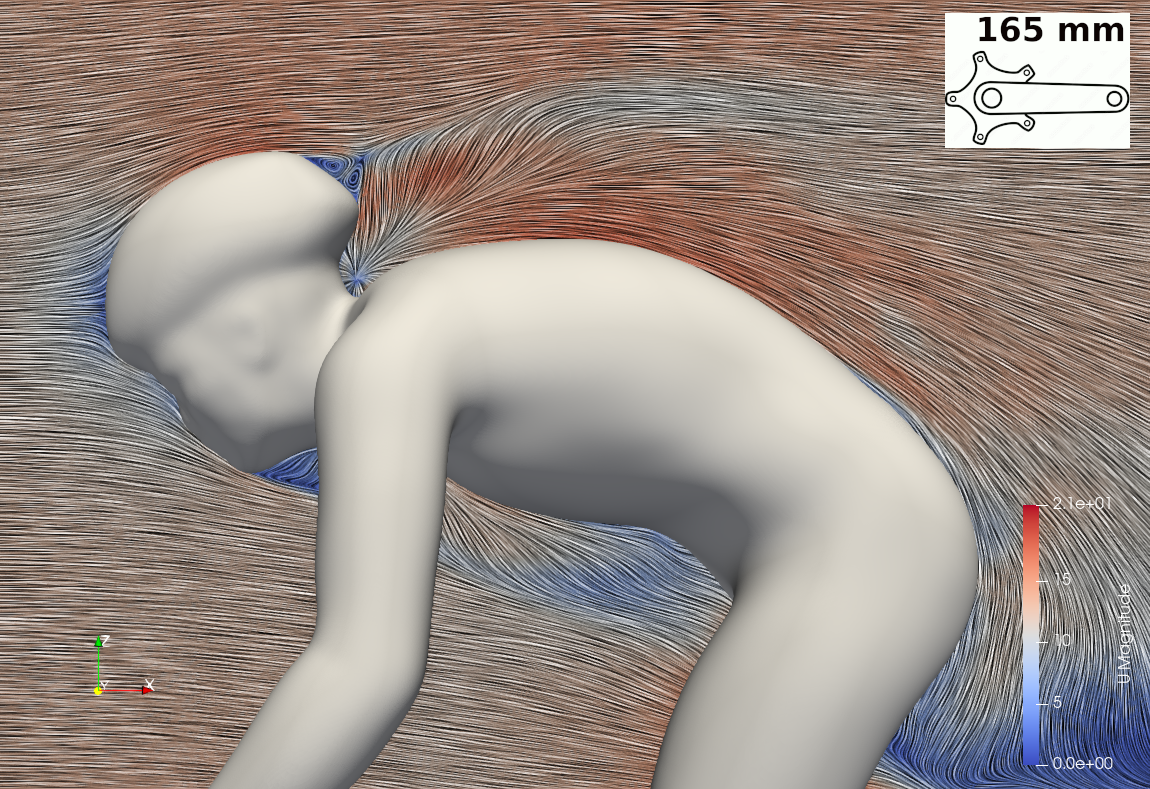
In this study, CFD simulations show that a shorter crank length combined with a lower torso position is an effective combination for reducing drag force. The posture identified as the “165 mm crank length posture” resulted in a significant 3.38% reduction in drag compared to “175 mm crank length posture”, and this value could be further improved with a properly designed helmet. Two approaches for determining the reference area were employed: the frontal area and the “normal area.” The contribution to the drag force is attributed to both a lower drag coefficient (Cd ) and a smaller reference area. Depending on the reference area approach, their influence varies: the two factors have nearly identical effects when the frontal area is used, while the drag coefficient plays a much more significant role when the normal area approach is applied.